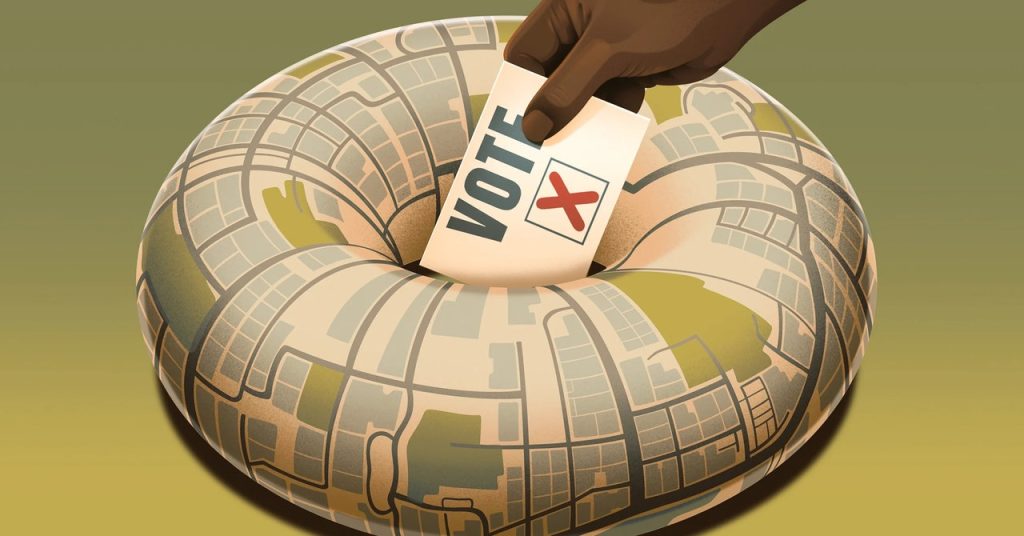
Topological Techniques Shed Light on Polling Place Accessibility
Adapting Topology for Discrete Data Analysis
While topology traditionally focuses on continuous shapes, recent advancements have allowed topologists to apply their tools to discrete data by creating graphs of points connected by lines. These techniques prove valuable not only for understanding the distribution of polling places but also for analyzing access to essential services like healthcare, food, and recreation.
Modeling Polling Place Accessibility with Growing Circles
To study polling site placement, researchers create circles around each point on the graph, with the radius initially set to zero. As time progresses, the circles expand, with locations having shorter wait times represented by larger circles and those with longer wait times by smaller ones. When circles touch, lines are drawn between their center points, and overlapping circles are connected into simplices, such as triangles (2-simplex) and tetrahedrons (3-simplex).

Identifying Accessibility Gaps through Holes and Death Times
The shapes formed by the expanding circles represent geographic locations where residents would have had sufficient time to vote. Empty areas completely surrounded by these shapes, called holes, indicate regions where residents are either traveling to the polls or waiting in line to vote. The time it takes for a hole to disappear, or “die,” reveals the level of polling place accessibility in that area. Longer death times suggest a lack of reasonable access to the polls.
Comparing Polling Place Accessibility Across Cities
By calculating the median death time and variance for each city, researchers can assess the overall accessibility and evenness of polling place distribution. The study found that Chicago had some of the lowest median death times, while New York and Atlanta had some of the highest. The greater Atlanta metropolitan area, including South Fulton and Cliftondale, was identified as a particularly challenging place to vote, with the highest death value in the entire study.
Future Directions and the Potential for Positive Change
While the researchers acknowledge the need for more granular data on wait times, the study demonstrates the power of sophisticated mathematical techniques in quantifying and understanding complex social issues. Drawing inspiration from the progress made in the math of gerrymandering over the past decade, the researchers hope to see more people working on these problems, paving the way for positive change in polling place accessibility and beyond.
“We’re at the humble beginnings right now,” he said. ”I do want to see more people working on these problems.”

4 Comments
Finally tackling voting deserts, that’s a game changer for democracy!
Diving into America’s voting deserts could really stir the pot, couldn’t it?
Shining a light on voting deserts, huh? About time someone did!
Sounds intriguing, but will it really make a difference in voter turnout? Let’s see.